Abstract: This application note contains some basic operating procedures that can help engineers use the Advantest® R3132 spectrum analyzer (or similar spectrum analyzer) to complete the measurement of return loss and provide a correlation for measuring return loss in the laboratory. Knowledge. Some of the specific key operations are only applicable to the R3132 spectrum analyzer, but some basic operating procedures are applicable to all spectrum analyzers. This application note is not a comprehensive user guide. Readers also need to master some basic operation knowledge of spectrum analyzers.
Return loss requirements The input return losses specified in E3, ITU G.703 and ETS 300-686 are listed in Table 1, and the output return loss requirements are listed in Table 2.
Table 1. Minimum return loss at the input
Table 2. Minimum return loss at the output
The return loss measurement of the Dallas Semiconductor Line Interface Unit (LIU) A.2.5 and A.2.6 rules in the ETS 300-686 specification gives test equipment and procedures for measuring E3 return loss. The test device shown in Figure 1 is used to measure input return loss and verify compliance with Table 1. The measuring device of output return loss is similar, just connect the measuring device originally connected to the input of the receiver to the output of the transmitter.
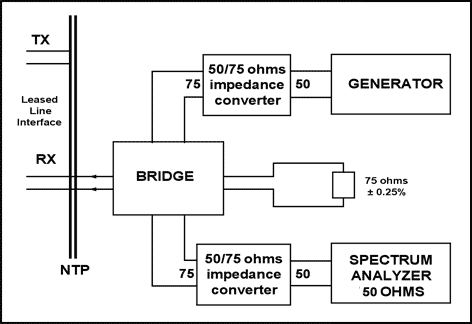
Figure 1. Return loss measurement device
In the Dallas Semiconductor device measurement device shown in Figure 1, the return loss test bridge uses A57TLSTD of Wide Band Engineering, Inc. Two 50Ω / 75Ω impedance converters (A65L from Wide Band Engineering) are used to connect the 75Ω bridge to the 50Ω signal generator and 50Ω spectrum analyzer port. The 75Ω precision resistor on the right side of the bridge in Figure 1 is a component of the return loss test bridge. The Advantest R3132 spectrum analyzer acts as both a signal generator and a spectrum analyzer in Figure 1.
In the device shown in Figure 1, the frequency range of the signal generator is 860kHz to 51,550kHz, providing a sinusoidal signal with a peak value of 1V.
To check the test setup before measuring the return loss, the bridge's NTP interface (the interface on the left in Figure 1) should be connected to a 75Ω (± 0.25Ω) test load. In the device shown in Figure 1, this precision resistor is a component of the Wide Band Engineering return loss test bridge. When using this resistor as a test load, the return loss should be 20 dB higher than the return loss required by Table 1. Main functions of the spectrum analyzer The main functions required to measure the return loss are the following six items: Frequency setting Reference level setting Bandwidth, sweep time, trigger control setting Tracking generator setting Tracking control setting Use the marker function to measure return loss dB unit) Frequency setting The following steps are used to set the frequency range of the spectrum analyzer: Press the FREQ key on the front panel. Press soft key # 2 (Start), use the numeric keypad and unit keys (GHz, MHz, kHz, or Hz) to enter the start frequency. From Table 1 and Table 2, we can see that the starting frequency of the input port and output port are 860kHz, as shown in Figure 2.
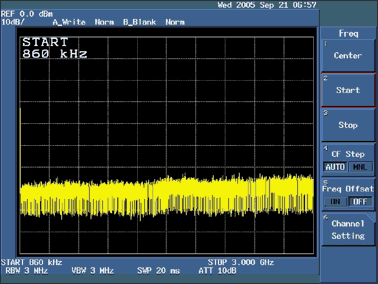
Figure 2. Set the start frequency to 860kHz
Press soft key # 3 (Stop) and enter the cutoff frequency using the numeric keypad and unit keys (GHz, MHz, kHz, or Hz). As can be seen from Table 1 and Table 2, the cut-off frequency of the input port and output port are both 51.55MHz, as shown in Figure 3.
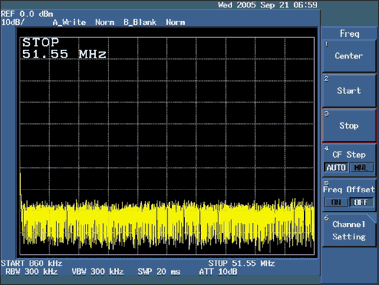
Figure 3. Set the cutoff frequency to 1.55MHz
The rest of the settings can use default values. Reference level setting The following steps are used to set the reference level of the spectrum analyzer: Press the LEVEL key on the front panel. Press soft key # 2 (ATT) and select AUTO. Press soft key # 3 (dB / div) to select the display mode of dB / div. Select soft key # 1 (10dB / div) as the decibel value corresponding to each scale, as shown in Figure 4. Then press RETURN.
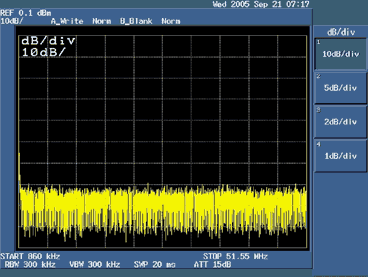
Figure 4. Select 10dB / div as the decibel value corresponding to each scale
Press soft key # 5 (Units) and select soft key # 1 (dBm) as the desired display unit, as shown in Figure 5, and then press RETURN.
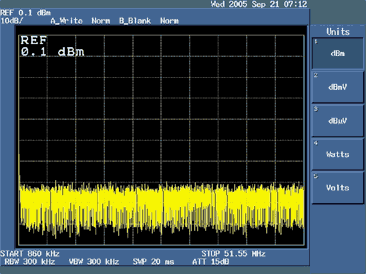
Figure 5. Select dBm as the display unit
Press soft key # 1 (Ref Level) and use the numeric keypad to enter the desired reference level. You can also use the knob to select the desired level. We use 0.1dBm to measure the return loss. The rest of the settings can use default values. Bandwidth, sweep time and trigger control settings The following steps are used to set the bandwidth, sweep time and trigger control of the spectrum analyzer: Press the BW key on the CONTROL board. Press soft key # 7 (Auto All) to automatically set the resolution and video bandwidth. Press the SWEEP button on the CONTROL board. Press soft key # 2 (Auto All) to automatically set the scan time. Press soft key # 6 (Gated Sweep) and select OFF. Press soft key # 7 (Ext Gate In) and select OFF. Press the TRIG key on the CONTROL board. Press soft key # 1 (Trig Source), select Free Run and click RETURN. The rest of the settings can use default values. Tracking generator setting The following steps are used to set the tracking generator output of the spectrum analyzer: Press the TG key on the front panel. Press soft key # 1 (TG Level), use the numeric keypad and unit keys (+ dBm or -dBm) to input the required output signal level value. The knob can be used to adjust the output signal level. We use 0.0dBm to measure the return loss. Press soft key # 4 (Ref Line, set the reference level to normalize the input signal. Use the numeric keypad and unit keys (+ dBm or -dBm) to input the required reference level. You can use the knob to adjust the output For signal level, we use -20dBm to measure the return loss. Press soft key # 3 (Norm Corr) and select OFF. Normalization is disabled, and a new set of calibration data can be saved in the next step. Press soft Key # 2 (Execute Normalize), save the calibration data and normalize the input signal to the reference level. The rest of the settings can use the default values. Tracking control settings The following steps are used to set the tracking oscillator of the spectrum analyzer: Press Press the TRACE key on the CONTROL board. Press soft key # 1 (Write A) to display the input signal trace. Press soft key # 5 (Detector) to select the desired signal trace detection method (Normal, Posi, Negi, or Sample). Normal displays both positive and negative peaks; Posi displays only positive peaks; Negi displays only negative peaks; Sample displays the current signal trace. To measure return loss, select soft key # 4 (Sample), as shown in Figure 6, and then Click the RETURN button.
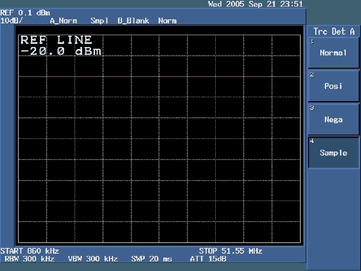
Figure 6. Select the Sample mode to display the current signal trace
Press soft key # 7 (1/2, more) to display the settings of the next soft key. Select soft key # 1 (AVG A), keep it in the ON mode, and press the RETURN key. Press soft key # 7 (2/2, more) again to return to the initial setting of the soft key. The rest of the settings can use default values. To measure the return loss (in dBm) Press the MEAS key on the MARKER board. Press soft key # 1 (Noise / Hz) as shown in Figure 7.
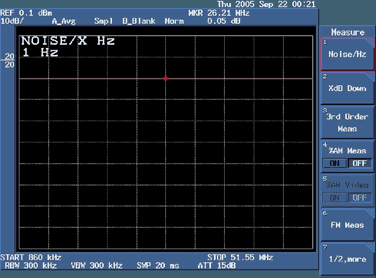
Figure 7. Choose Noise / Hz for return loss measurement
Press soft key # 1 (dBm / Hz).
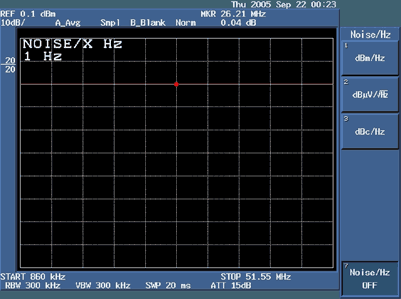
Figure 8. Choosing dBm / Hz for return loss measurement
Press soft key # 7 (Noise / Hz OFF), as shown in Figure 8. Connect the 75Ω load to the test bridge and measure its dB value.
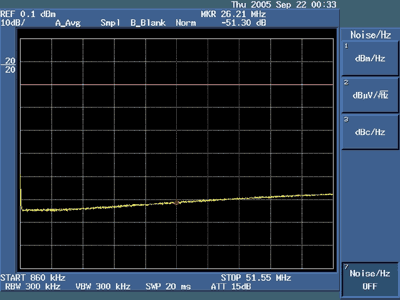
Figure 9. Return loss with 75Ω load
Press the MKR key on the MARKER board, and then use the knob to select the frequency value to be measured, and measure the return loss at that frequency, as shown in Figure 9. Connect the device under test (DUT) and the test bridge, use the knob to select the frequency value to be measured, and measure the return loss at that frequency. We will measure the return loss at 860kHz, 1.720MHz, 34.3680MHz and 51.55MHz. Use the knob to select one of these frequencies. The user can also select the frequency of interest and measure the return loss. Measure the return loss of the device under test (DUT) at 860kHz, as shown in Figure 10.
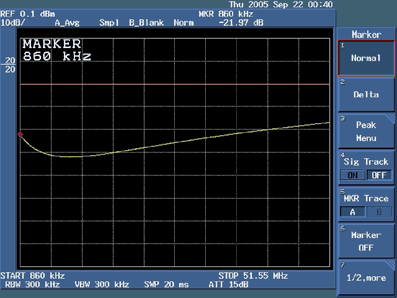
Figure 10. Return loss of the device under test (DUT) at 860kHz
Measure the return loss of the device under test (DUT) at 1.72MHz, as shown in Figure 11.
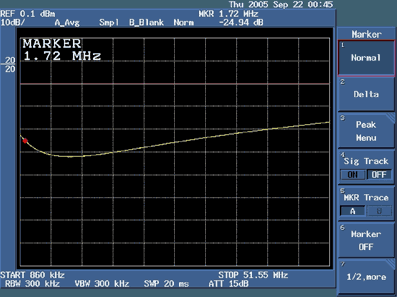
Figure 11. Return loss of the device under test (DUT) at 1.72MHz
Measure the return loss of the device under test (DUT) at 34.368MHz, as shown in Figure 12.
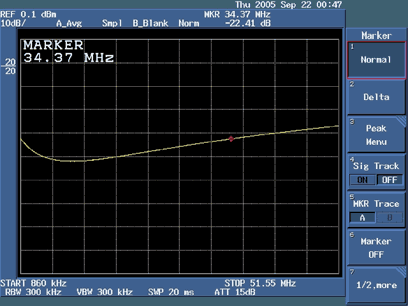
Figure 12. Return loss of the device under test (DUT) at 34.37MHz
Measure the return loss of the device under test (DUT) at 51.35MHz, as shown in Figure 13.
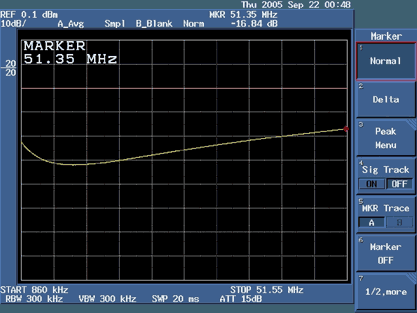
Figure 13. Return loss of the device under test (DUT) at 51.35MHz
Return loss requirements The input return losses specified in E3, ITU G.703 and ETS 300-686 are listed in Table 1, and the output return loss requirements are listed in Table 2.
Table 1. Minimum return loss at the input
| Frequency Range (kHz) | Return Loss (dB) |
| 860 to 1720 | 12 |
| 1720 to 34,368 | 18 |
| 34,368 to 51,550 | 14 |
Table 2. Minimum return loss at the output
| Frequency Range (kHz) | Return Loss (dB) |
| 860 to 1720 | 6 |
| 1720 to 51,550 | 8 |

Figure 1. Return loss measurement device
In the Dallas Semiconductor device measurement device shown in Figure 1, the return loss test bridge uses A57TLSTD of Wide Band Engineering, Inc. Two 50Ω / 75Ω impedance converters (A65L from Wide Band Engineering) are used to connect the 75Ω bridge to the 50Ω signal generator and 50Ω spectrum analyzer port. The 75Ω precision resistor on the right side of the bridge in Figure 1 is a component of the return loss test bridge. The Advantest R3132 spectrum analyzer acts as both a signal generator and a spectrum analyzer in Figure 1.
In the device shown in Figure 1, the frequency range of the signal generator is 860kHz to 51,550kHz, providing a sinusoidal signal with a peak value of 1V.
To check the test setup before measuring the return loss, the bridge's NTP interface (the interface on the left in Figure 1) should be connected to a 75Ω (± 0.25Ω) test load. In the device shown in Figure 1, this precision resistor is a component of the Wide Band Engineering return loss test bridge. When using this resistor as a test load, the return loss should be 20 dB higher than the return loss required by Table 1. Main functions of the spectrum analyzer The main functions required to measure the return loss are the following six items: Frequency setting Reference level setting Bandwidth, sweep time, trigger control setting Tracking generator setting Tracking control setting Use the marker function to measure return loss dB unit) Frequency setting The following steps are used to set the frequency range of the spectrum analyzer: Press the FREQ key on the front panel. Press soft key # 2 (Start), use the numeric keypad and unit keys (GHz, MHz, kHz, or Hz) to enter the start frequency. From Table 1 and Table 2, we can see that the starting frequency of the input port and output port are 860kHz, as shown in Figure 2.

Figure 2. Set the start frequency to 860kHz
Press soft key # 3 (Stop) and enter the cutoff frequency using the numeric keypad and unit keys (GHz, MHz, kHz, or Hz). As can be seen from Table 1 and Table 2, the cut-off frequency of the input port and output port are both 51.55MHz, as shown in Figure 3.

Figure 3. Set the cutoff frequency to 1.55MHz
The rest of the settings can use default values. Reference level setting The following steps are used to set the reference level of the spectrum analyzer: Press the LEVEL key on the front panel. Press soft key # 2 (ATT) and select AUTO. Press soft key # 3 (dB / div) to select the display mode of dB / div. Select soft key # 1 (10dB / div) as the decibel value corresponding to each scale, as shown in Figure 4. Then press RETURN.

Figure 4. Select 10dB / div as the decibel value corresponding to each scale
Press soft key # 5 (Units) and select soft key # 1 (dBm) as the desired display unit, as shown in Figure 5, and then press RETURN.

Figure 5. Select dBm as the display unit
Press soft key # 1 (Ref Level) and use the numeric keypad to enter the desired reference level. You can also use the knob to select the desired level. We use 0.1dBm to measure the return loss. The rest of the settings can use default values. Bandwidth, sweep time and trigger control settings The following steps are used to set the bandwidth, sweep time and trigger control of the spectrum analyzer: Press the BW key on the CONTROL board. Press soft key # 7 (Auto All) to automatically set the resolution and video bandwidth. Press the SWEEP button on the CONTROL board. Press soft key # 2 (Auto All) to automatically set the scan time. Press soft key # 6 (Gated Sweep) and select OFF. Press soft key # 7 (Ext Gate In) and select OFF. Press the TRIG key on the CONTROL board. Press soft key # 1 (Trig Source), select Free Run and click RETURN. The rest of the settings can use default values. Tracking generator setting The following steps are used to set the tracking generator output of the spectrum analyzer: Press the TG key on the front panel. Press soft key # 1 (TG Level), use the numeric keypad and unit keys (+ dBm or -dBm) to input the required output signal level value. The knob can be used to adjust the output signal level. We use 0.0dBm to measure the return loss. Press soft key # 4 (Ref Line, set the reference level to normalize the input signal. Use the numeric keypad and unit keys (+ dBm or -dBm) to input the required reference level. You can use the knob to adjust the output For signal level, we use -20dBm to measure the return loss. Press soft key # 3 (Norm Corr) and select OFF. Normalization is disabled, and a new set of calibration data can be saved in the next step. Press soft Key # 2 (Execute Normalize), save the calibration data and normalize the input signal to the reference level. The rest of the settings can use the default values. Tracking control settings The following steps are used to set the tracking oscillator of the spectrum analyzer: Press Press the TRACE key on the CONTROL board. Press soft key # 1 (Write A) to display the input signal trace. Press soft key # 5 (Detector) to select the desired signal trace detection method (Normal, Posi, Negi, or Sample). Normal displays both positive and negative peaks; Posi displays only positive peaks; Negi displays only negative peaks; Sample displays the current signal trace. To measure return loss, select soft key # 4 (Sample), as shown in Figure 6, and then Click the RETURN button.

Figure 6. Select the Sample mode to display the current signal trace
Press soft key # 7 (1/2, more) to display the settings of the next soft key. Select soft key # 1 (AVG A), keep it in the ON mode, and press the RETURN key. Press soft key # 7 (2/2, more) again to return to the initial setting of the soft key. The rest of the settings can use default values. To measure the return loss (in dBm) Press the MEAS key on the MARKER board. Press soft key # 1 (Noise / Hz) as shown in Figure 7.

Figure 7. Choose Noise / Hz for return loss measurement
Press soft key # 1 (dBm / Hz).

Figure 8. Choosing dBm / Hz for return loss measurement
Press soft key # 7 (Noise / Hz OFF), as shown in Figure 8. Connect the 75Ω load to the test bridge and measure its dB value.

Figure 9. Return loss with 75Ω load
Press the MKR key on the MARKER board, and then use the knob to select the frequency value to be measured, and measure the return loss at that frequency, as shown in Figure 9. Connect the device under test (DUT) and the test bridge, use the knob to select the frequency value to be measured, and measure the return loss at that frequency. We will measure the return loss at 860kHz, 1.720MHz, 34.3680MHz and 51.55MHz. Use the knob to select one of these frequencies. The user can also select the frequency of interest and measure the return loss. Measure the return loss of the device under test (DUT) at 860kHz, as shown in Figure 10.

Figure 10. Return loss of the device under test (DUT) at 860kHz
Measure the return loss of the device under test (DUT) at 1.72MHz, as shown in Figure 11.

Figure 11. Return loss of the device under test (DUT) at 1.72MHz
Measure the return loss of the device under test (DUT) at 34.368MHz, as shown in Figure 12.

Figure 12. Return loss of the device under test (DUT) at 34.37MHz
Measure the return loss of the device under test (DUT) at 51.35MHz, as shown in Figure 13.

Figure 13. Return loss of the device under test (DUT) at 51.35MHz
Product categories of E-bike Battery, we are specialized in manufacturers from China, Electric Bike Battery Supplier suppliers/factory, wholesale high-quality products of manufacturing, we have the perfect after-sales service and technical support. Look forward to your cooperation!
E-bike Battery
Battery Bicycle,Ebike Battery,E Bike Battery,48V Ebike Battery
Changxing Deli Technology Co., Ltd. , https://www.delipowers.com